

ETF Monkey Personal Portfolio And Asset Location Update - Q2 2023
I honestly share what went well, and not so well, including a helpful by-ETF breakout.


Introductory Notes:
In particular for new readers, if you are unfamiliar with what I am referring to by asset location, as well as how I am providing in-depth detail on my portfolio while maintaining a measure of privacy, please feel free to refer to the details I provided in my year-end portfolio update for 2022.
The beginning balance on this report does not tie to the ending balance on that linked report. This simply reflects a year-end withdrawal to fund my budgeted spending for 2023. For purposes of tracking investment performance, I start with the net amount as my beginning 2023 balance.
Following the withdrawal of 2023 living expenses featured above, I ended Q4 2022 with a new factored amount of $944,671.25. I start from that point and present things on that same factored basis for this update.
Let’s get right into it then, shall we?
The Bottom Line
Due to an extended European vacation that crossed over from March into April, I was unable to complete the Q1 update that I would have normally provided. However, I will show the respective results for Q1 and Q2 below, and offer some color around decisions I made and how they have played out to-date.
Here’s a quick look at how the major US indexes have fared, showing both the Q2 and YTD changes, as well as how my personal portfolio has fared.

During Q2, my portfolio managed a gain of 1.52%. The YTD number is a gain of 5.63%. Interestingly, a model portfolio I manage for the Hoya Capital Income Builder marketplace service on Seeking Alpha managed gains of 2.15% and 5.95%, respectively, over this same period. I’ll get into further detail with respect to some differences in the next section.
As can be seen, my returns during the first half of 2023 were modest. As an aid in analyzing this, with the help of GOOGLEFINANCE functions I put together a comprehensive spreadsheet, breaking out the results by ETF. Have a look, and then I will offer just a few brief comments.

During the first half, it can clearly be seen that a small subset of stocks were huge winners, while other asset classes performed modestly. When you compare my list of ETFs to the U.S. market averages displayed in the first graphic, you will see that my decision late last year to include some QQQM in my Roth IRA was a big score for me. Other than that, ITOT and VTI, my two U.S. total market ETFs were the only two that generated double-digit returns during this period. Mostly, the huge winners were in the technology section of the U.S. market, very likely driven by all the excitement around artificial intelligence (AI). At the same time, several of those stocks were bid up to price/earnings and, even more notably, price/sales ratios that may simply prove unsustainable over the long term.
Regular readers will know that I have long been recommending including an allocation to international stocks in one’s portfolio. Looking at the graphic above, please note that IXUS and VEU were also relatively strong performers during the first half of the year. If you look even more closely, however, you will notice that most of this came during Q1 and that Q2 was a little softer. As a result, should one decide to swap a little of those recent gains in U.S. equities in favor of international entities, you would probably not be overpaying in relative terms to do so.
As can be seen, the returns on just about every other ETF in the portfolio were modest and, in come cases, negative. A surprising example of this was SCHD. This ETF, considered by many to be the gold standard of dividend-focused ETFs, performed quite poorly in this environment, as the types of quality stocks it features were not where investors were placing their money at this time.
The Big Picture
As I have featured previously, I first summarize the detail into 8 asset classes, and then at an even higher level into 4 asset classes. This helps me see the big picture, as well as the really big picture. As an example, I can see my weightings of domestic and foreign bonds, as well as TIPs, and how they line up against my target weights. But then I can also see the weighting for bonds as a whole.
Now that I am breaking out my portfolio, not just in terms of totals, but also in terms of asset location, I apologize for the fact that this first graphic is a little “busy.” But I will try to break it down so it is understandable.
First of all, the graphic summarizes my amounts by detailed asset class, but further between my investment account (shown as “real”), my IRAs, and finally my Roth IRAs. The bottom two sections are the totals, first by the 8 asset classes, and then at an even higher level into 4 asset classes, as referred to above. In each case, I compare them against my target weights and identify differences.
Next, on the far right of the graphic, I included my weighting as of the last quarter (12/31/22 in this case) and then a computed column to display the difference. I then color-coded in green and red to visually feature which weightings increased, and which decreased.

To help you ground yourself, then, take a look at the bottom line of roughly $998K and compare it against the $945K amount in the 12/31/22 column. As you can quickly see, the difference is the 5.63% gain I reported in the “bottom line” section.
The first item that may jump out at you from this top-level summary is that I removed my allocation to gold ETFs during Q1 of 2023. At the time I did so, I explained my rationale in this article. As a result, my 8 overall asset classes and 4 top-level asset classes have now dropped to 7 and 3, respectively.
I will break down some of the other decisions I made during the quarter in greater detail in the sections below. However, in terms of the very biggest picture, focus for just a second on the high-level summary at the bottom of the graphic. You will see that I continued to raise the cash level in my portfolio during 2023. I offer a fairly detailed rationale for this decision in a recent post entitled Rethinking 60/40 - Your Best Portfolio Right Now Might Be 30/30/40
NOTE: If you are a new reader, you might also want to catch up here and here to get additional insights into my thinking on this.
To close out this section, here are my detailed holdings as of 6/30/23. Again, you can see how each position has changed since my last report.

With that, let’s get into the detail in terms of asset location.
Taxable Accounts (TA)
Separately broken out, here is the portion of my portfolio in taxable accounts.

Next, the by-security detail of this portion.

In a series of two articles last year, I went into great detail about my personal circumstances and the theory behind my asset location decisions.
The biggest change in my taxable accounts during the first half was that, after holding AAPL for many years, I made the decision to divest myself of this last single-stock holding, diversifying most of the proceeds into VTI. As a result, at this time at least, my portfolio is completely ETF-based. I might note that AAPL goes back and forth with MSFT as the top holding in QQQM, which I hold in my Roth IRA. As a result, indirectly, I still have decent exposure to this company.
Related to tax planning, a key to this decision is that I will not have to pay any income taxes on the long-term gains I had in this stock. I am deliberately keeping my income this year below the threshold that would trigger tax on these gains.
Other than that, during the first half of 2023 this portion of the portfolio remained fairly static, with the exception of the fact that I raised my cash level, as I did throughout the portfolio.
Tax-Deferred and Tax-Exempt Accounts (TDA & TEA)
In previous updates, I broke these out into two separate sections, in line with my asset allocation articles. Now that I hope I have made all the necessary points, I am combining my two sets of retirement accounts (IRAs and Roth IRAs) into this one section.
Here, then, is the portion of my portfolio in tax-deferred accounts.

Next, the by-security detail of this portion.
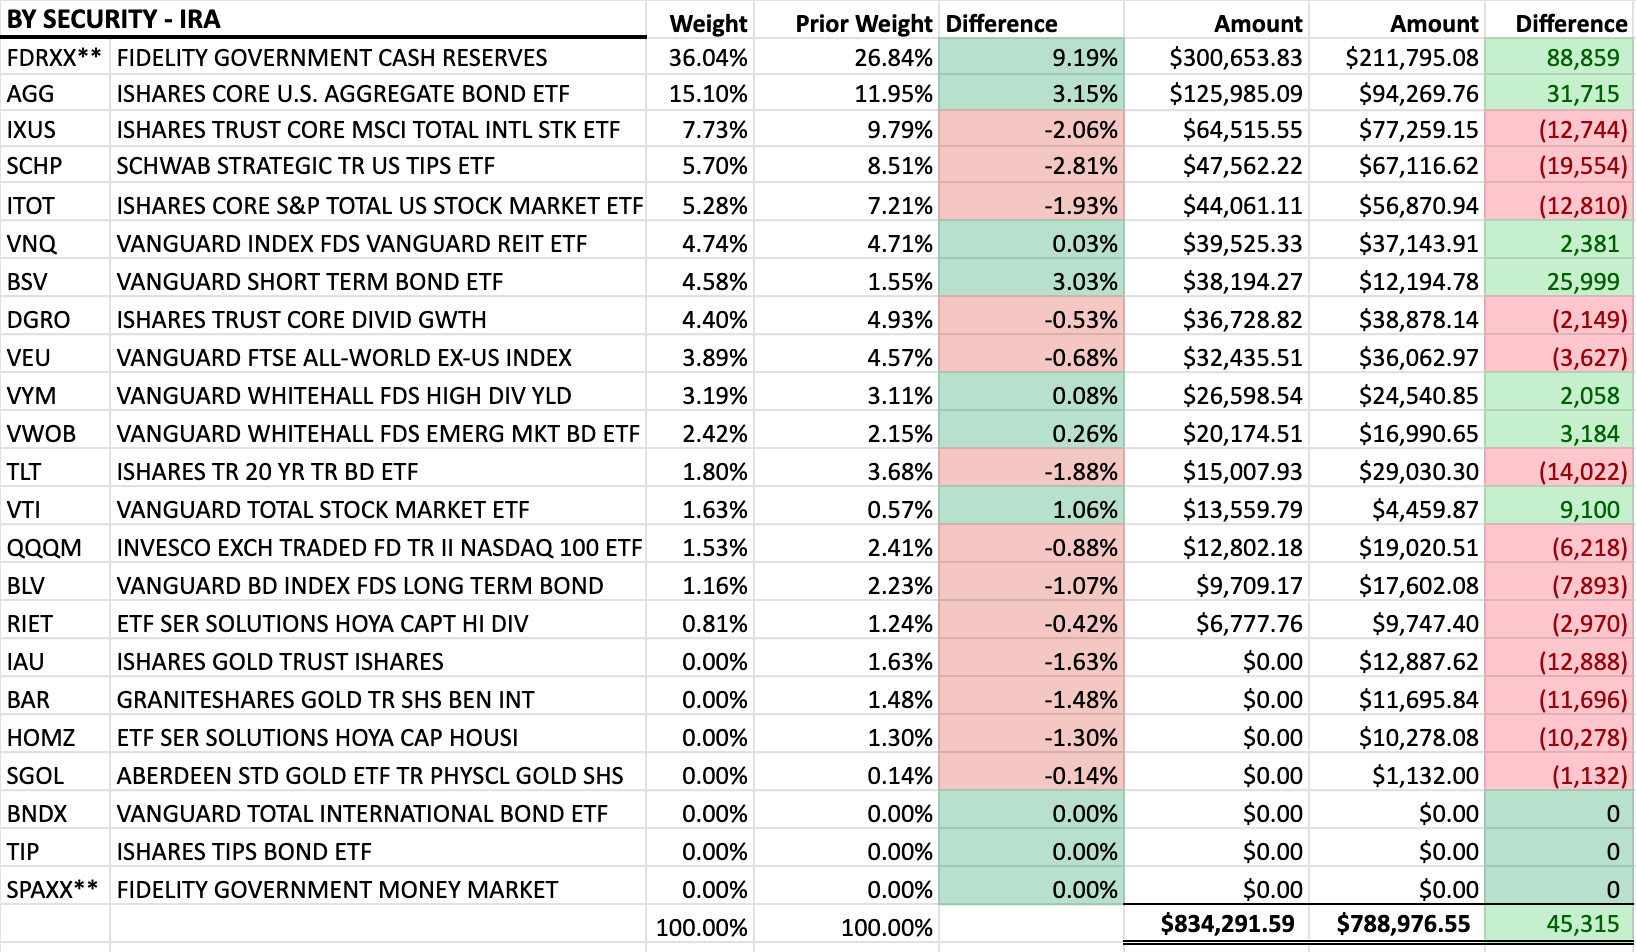
Please note that the $834,291 balance reflected in the detail is the sum of the $708,279 in my regular IRAs (TDA) and $126,012 in Roth IRAs (TEA) reflected in the first graphic in this section. In my spreadsheet, I combine the detail because I want to be able to identify the total amount I have in each ETF, so I can accurately see its share of the whole.
As featured in my asset allocation articles, this is the second “bucket” of assets I will dip into. In previous articles, I said that I would likely do this in 3 to 4 years. However, it may prove to be the case that I dip into a combination of this and my taxable bucket as soon as next year, to smooth out my income tax bracket.
In this final section, I will make 3 observations:
My substantial cash allocation in these accounts is in line with the articles linked above. As it turns out, this significant cash allocation was the biggest reason I slightly underperformed the model portfolio I manage for Hoya. I raised cash in that portfolio as well, but only to the level of 10%. While I follow the same principles in that portfolio as in my own, I tend to lean towards the side of being more fully invested.
Early in January, 2023, I made my second significant transfer of funds into my Roth IRAs, continuing with the same strategy I laid out in detail in this article. As a result, you will notice that the balance in my normal IRAs dropped during this period and the balance in the Roth IRAs jumped substantially.
You may note that my Q2 ending balance in QQQM is lower than the starting point. As featured at the outset of the article, QQQM was an amazingly-strong performer during the first half. I made the decision to substantially lower my weighting for now and have set GTC limit buy orders at prices roughly 2, 4, and 6% below current levels.
Summary and Conclusion
Since this article is already quite lengthy, with multiple links to further reading for any who are interested, I will leave things here for now. I will return with additional thoughts on the path forward in future articles.
I hope this has been of some use to you in evaluating your own decisions. I’d love to hear your comments, and even critique, in the comments section below.
Nice to see the detail. These are all long term buy and hold (with no firm expectations of a sale at some defined future time or event)? And why did you decide to go "All ETF"? Do you track the correlations between the ETFs? Have you done any kind of backtesting on a portfolio containing these classes?