


ETF Monkey Personal Portfolio And Asset Location Update - Q3 2023
In which I play a little defense and turn in decent quarterly results.

Introductory Notes:
In particular for new readers, if you are unfamiliar with what I am referring to by asset location, as well as how I am providing in-depth detail on my portfolio while maintaining a measure of privacy, please feel free to refer to the details I provided in my year-end portfolio update for 2022.
My Q2 2023 portfolio report is linked here.
I ended Q2 2023 with a factored amount of $997,870.09. I start from that point and present things on that same factored basis for this update.
Let’s get right into it then, shall we?
The Bottom Line
In my Q2 portfolio update, I noted that a small subset of stocks were huge winners YTD, while other asset classes performed modestly. Mostly, the huge winners were in the technology section of the U.S. market, very likely driven by all the excitement around artificial intelligence (AI). My decision in late-2022 to include some QQQM in my Roth IRA turned out well for me. Other than that, ITOT and VTI, my two U.S. total market ETFs, were the only ETFs that generated double-digit returns during this period.
Here’s a quick look at how the major US indexes have fared since that update, showing both the Q3 and YTD changes, as well as how my personal portfolio has fared.

During Q3, my portfolio experienced a loss of 2.03%. My YTD number is a gain of 3.49%. All in all, I am happy with this relative Q3 performance, compared to declines of between 2.62% and 4.12% in the major U.S. averages.
At the same time, my YTD returns remain modest, as measured against these same averages. As an aid in analyzing this, with the help of GOOGLEFINANCE functions I put together a comprehensive spreadsheet, breaking out the results by ETF. Have a look, and then I will offer just a few brief comments.

First off, it can quickly be seen that virtually no asset class was exempt from declines during this period. My two worst performers, each incurring double-digit losses in Q3, were BLV and TLT. Not far behind were my two REIT-focused holdings, RIET and VNQ. With exception of BSV, virtually every other ETF registered losses of between roughly 2.5% - 5.0%.
I did get a few things right during the quarter. My personal portfolio reached its YTD high on July 31. But I was uneasy, feeling that the market had risen too far too fast. On that exact date, I penned a few thoughts to my readers, and also revealed that I had raised my cash level to a full 40%. Exactly as I had thought, several asset classes, REITS in particular, experienced meaningful declines and I was able to buy back the shares I sold at lower prices.
At the same time, I underestimated the extent of the continuing rise in longer-term interest rates. I was hurt to a modest extent by the equivalent double-digit decline in the price of BLV and TLT featured at the outset of this section.
Next, though, let’s get into the details of my portfolio.
The Big Picture
As I have featured previously, I first summarize the detail into 7 asset classes, and then at an even higher level into 3 asset classes. This helps me see the big picture, as well as the really big picture. As an example, I can see my weightings of domestic and foreign bonds, as well as TIPs, and how they line up against my target weights. But then I can also see the weighting for bonds as a whole.
Now that I am breaking out my portfolio, not just in terms of totals, but also in terms of asset location, I apologize for the fact that this first graphic is a little “busy.” But I will try to break it down so it is understandable.
First of all, the graphic summarizes my amounts by detailed asset class, but further between my investment account (shown as “real”), my IRAs, and finally my Roth IRAs. The bottom two sections are the totals, first by the 7 asset classes, and then at an even higher level into 3 asset classes, as referred to above. In each case, I compare them against my target weights and identify differences.
Next, on the far right of the graphic, I included my weighting as of the last quarter (6/30/23 in this case) and then a computed column to display the difference. I then color-coded in green and red to visually feature which weightings increased, and which decreased.

To help you ground yourself, then, take a look at the bottom line of roughly $977K and compare it against the $998K amount in the Prior Amount column. As you can quickly see, the difference is the 2.03% loss I reported in the “bottom line” section.
I will break down some of the other decisions I made during the quarter in greater detail in the sections below. However, in terms of the very biggest picture, focus for just a second on the high-level summary at the bottom of the graphic. You will see that I used the market declines, particularly since July 31, to put some of the 40% cash allocation to work. I ended the quarter at right around 30%.
To close out this section, here are my detailed holdings as of 9/30/23. Again, you can see how each position has changed since my last report.

If you look closely at that right hand column, you will likely start to notice a clear theme. I have begun moving cash to bonds, including those longer-term bonds that fell so hard in Q3. I hope to return fairly shortly with another outlook article explaining my thoughts in greater detail. Be sure to subscribe to always be the first to receive these updates in your inbox.
With that, let’s get into the detail in terms of asset location.
Taxable Accounts (TA)
Separately broken out, here is the portion of my portfolio in taxable accounts.

Next, the by-security detail of this portion.

In a series of two articles last year, I went into great detail about my personal circumstances and the theory behind my asset location decisions.
As projected in that series of articles, I have now funded the first two full years of my retirement from my taxable account, simultaneously taking advantage of being in a low tax bracket to move money from my IRAs to Roth IRAs.
Looking to next year, I will likely modify that somewhat. I want to have some funds left in my taxable accounts in the event of emergency cash needs, such that I don’t encounter any “surprises” that I might have to fund with IRA withdrawals, potentially kicking me into a higher tax bracket. I am still working on the specifics but likely I will fund next year through a combination of withdrawals from taxable and tax-deferred accounts, along with still making at least a modest transfer to my Roth IRAs.
Tax-Deferred and Tax-Exempt Accounts (TDA & TEA)
In previous updates, I broke these out into two separate sections, in line with my asset allocation articles. Now that I hope I have made all the necessary points, I am combining my two sets of retirement accounts (IRAs and Roth IRAs) into this one section.
Here, then, is the portion of my portfolio in tax-deferred accounts.
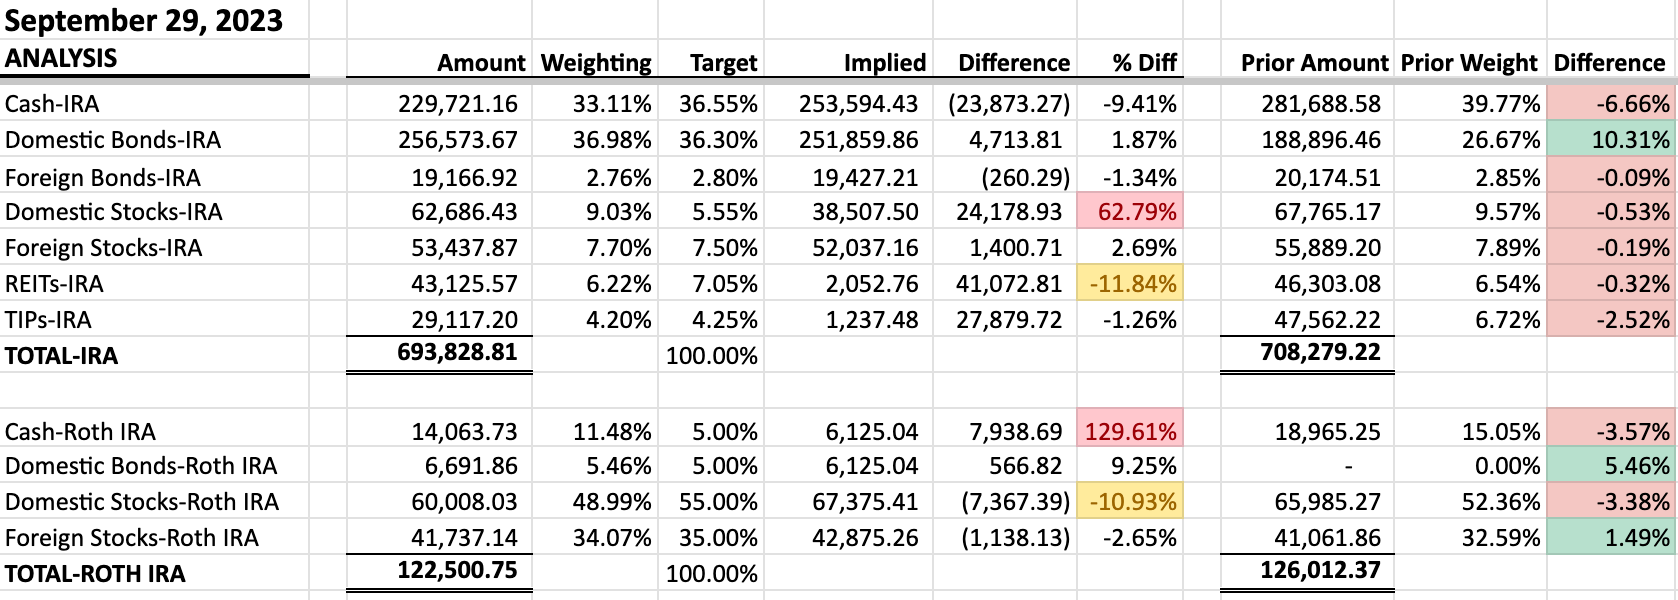
Next, the by-security detail of this portion.

Please note that the $816,330 balance reflected in the detail is the sum of the $693,829 in my regular IRAs (TDA) and $122,501 in Roth IRAs (TEA) reflected in the first graphic in this section. In my spreadsheet, I combine the detail because I want to be able to identify the total amount I have in each ETF, so I can accurately see its share of the whole.
As featured in my asset allocation articles, this is the second “bucket” of assets I will dip into. In previous articles, I said that I would likely do this in 3 to 4 years. However, as I alluded to previously in this article, it may prove to be the case that I dip into a combination of this and my taxable bucket as soon as next year, to smooth out my income tax bracket.
In this final section, I will make 2 observations in addition to those already shared above:
During Q3, I included a small allocation to bonds in my Roth IRA for the first time, using BND as my ETF of choice in this case. The reason for this decision, even though I should not need these funds for several years, will be very much in line with the thoughts on bonds I plan to share in future articles, again as alluded to previously in this report.
In my Q2 report, I noted that I had lowered my weighting QQQM. As featured at that time, QQQM was an amazingly strong performer during the first half. That outperformance continued in July, leading me to sell almost all my allocation, leaving myself with only a token amount remaining. Between that time and now, however, roughly half of the GTC limit buy orders I set at that time have triggered at lower prices, so my weighting in QQQM at the end of Q3 only modestly lower than at the end of Q2. If my guess as to what may happen over the next few months turns out to be correct, I may get all of those shares back at even lower prices.
Summary and Conclusion
Just one last thought before I leave you. When I first adopted this format for my portfolio summary articles, here is how I explained how I would preserve a measure of privacy in doing so.
I decided on $1 million as the amount to use for presentation purposes. I calculated the factor against which to multiply my total portfolio to arrive at an even million dollars. I then applied that factor against every component of my portfolio, such that all the relationships stayed the same.
That first exercise was for the quarter ending June 30, 2022. As can be seen, my (factored) portfolio balance as of this report was roughly $978K. In the interim, I withdrew the funds required to cover my living expenses for 2023, moving these to my online savings accounts. As I write this, I am still on pace for these funds to get me through the year. I will make my next set of withdrawals this coming December, to fund 2024.
In the biggest of pictures then, setting aside all talk of strategies, percentages, allocations and other details—and during what can only be described as a difficult investment year—I have been able to cover all my living expenses and my investment balance is only marginally below where it was some 15 months ago. That includes living in one of the more expensive locations, and dealing with some of the highest combined fed/state tax brackets, in the U.S. It also includes covering all health care expenses for my family until such time as my wife and I become eligible for Medicare. Lastly, this is the case at the end of a quarter in which my portfolio declined by 2.03%.
My message? If I can do it, you can too.
I hope this has been of some use to you in evaluating your own decisions. I’d love to hear your comments, and even critique, in the comments section below.