


My View Of Where We Stand Right Now
In which I try to make sense of multiple data points to come up with a holistic view.

In today’s post, I hope to use a series of pictures, as opposed to a ton of words, to share my view of where we stand at the moment with respect to our investment stance. As you read this, please bear in mind that I write primarily for investors at or nearing retirement age, although I believe the information I will share here has value for all.
About two months ago, I wrote the post linked below.
Rethinking 60/40 - Your Best Portfolio Right Now Might Be 30/30/40

Late in Act I of the musical Hamilton is a song entitled “The World Turned Upside Down.” This refers to the famous Battle of Yorktown. In this decisive battle, the British Army was forced to surrender to a combination of George Washington’s American forces and their French allies. This marked the conclusion of the la…
In essence, I argued that, at present, a portfolio comprised of at least 30% cash, supported by a 30% allocation to bonds, and an allocation of no more than 40% stocks—including an allocation to international stocks—might offer the best risk-adjusted returns moving forward, at least in the short term.
In that article I shared a Vanguard chart laying out its 10-year annualized nominal return and volatility forecast for various asset classes. What jumps out from that chart is that Vanguard’s view is that U.S. stocks offer, at best, middling risk-adjusted returns over this time frame.
With that background, let me now quickly share a series of charts and graphics—along with brief commentary—that I believe are in support of the views shared in the linked article above.
Asset Classes
First off, here is the current status as of this morning, August 24, 2023, of the Shiller PE Ratio, also commonly referred to as the Cyclically Adjusted PE Ratio or CAPE Ratio.
")
As can be seen, this currently stands at a fairly high level, historically speaking. In light of what the Fed has done with interest rates over the past year, I feel that caution is warranted with respect to the U.S. stock market.
Next, with respect to that Vanguard 10-year forecast referred to above, a quick graphic quickly showing the relative performance of various asset classes over the past 3 years.

In this graphic, I selected 5 ETFs to do this, as follows:
SPY - U.S. stock market
VXUS - International stock markets
BSV - Relatively short-term bonds
BND - Total U.S bond market
TLT - Long-term Treasuries
Now, I could have selected other ETFs to include. For example, it could be argued that BLV would have been a better counterpart to BSV and BND. However, the basic point I hope to make is the same.
As can be seen, U.S. stocks have dramatically outperformed everything else, up 36.69% over the past 3 years. International stocks are right in the middle, up a mere 7.08%. And bonds? We start with short-term bonds, down 8.88% and end with long-term bonds, down a whopping 39.93%!
Bottom line? U.S. stocks are expensive, in relative terms.
Do you see where Vanguard may be coming from with its 10-year forecast?
Debt
I have featured this before, but here is a screen capture from the latest NY Fed report on U.S. household debt.

Bottom line? During Q2 2023, overall debt surpassed $17 trillion and credit card debt surpassed $1 trillion, both for the first time.
More recent evidence appears to suggest that this is beginning to cause some real issues. Here’s something from the Macy’s earnings call, just 2 days ago.
")
In short, the Macy’s CFO said “We anticipated that delinquency would get worse, but it did so more dramatically than we expected.”
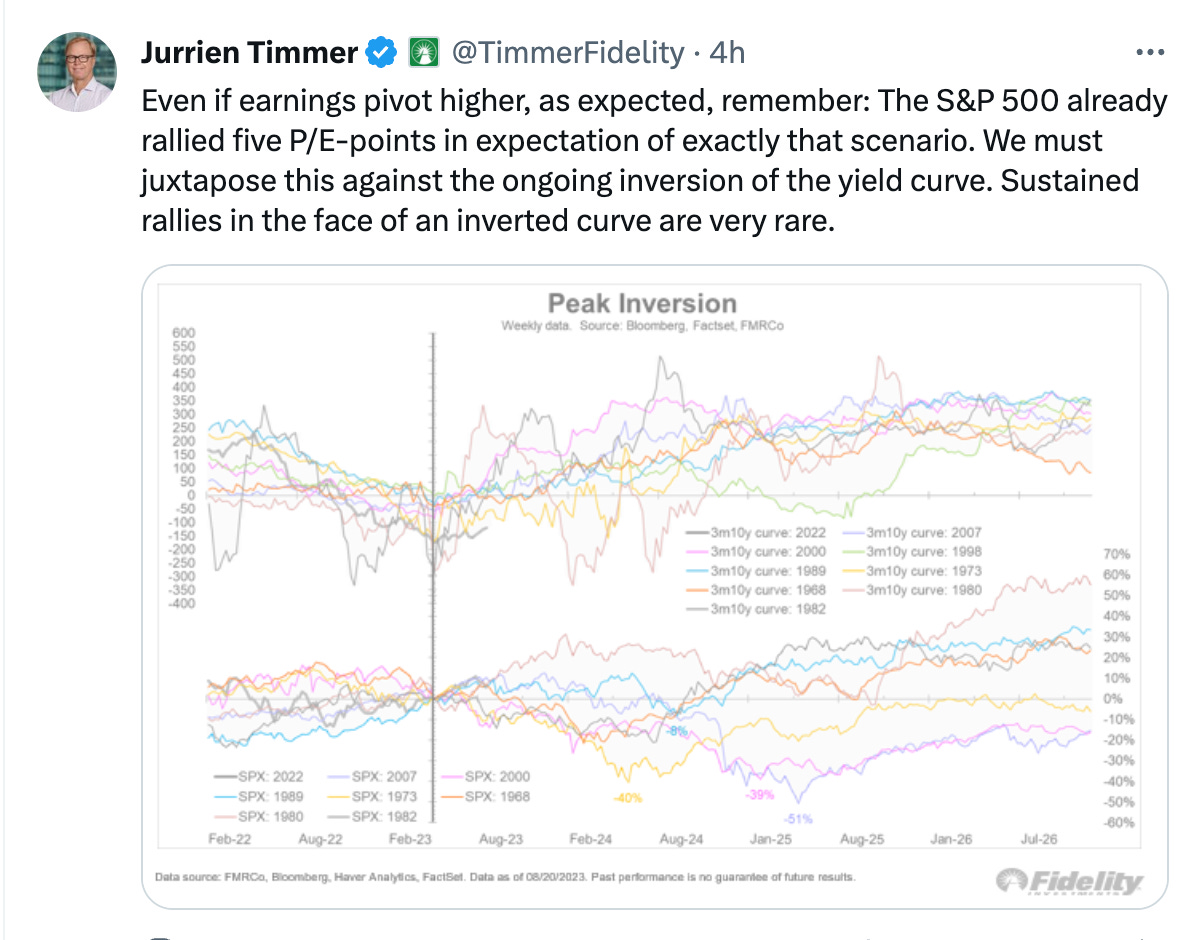
One Last Thought - From Jurrien Timmer
If any of you follow Jurrien Timmer of Fidelity, you might think of him as “Mr. Charts.” He loves charts and has all sorts of interesting insights.
This one came just this morning.
Putting It All Together
Putting it all together, I still believe in the logic presented in the article linked at the outset of this article, as follows:
I think investors, in particular conservative investors, are wise to hold a solid allocation in cash at this time. Cash currently offers roughly a 4.5% risk-free return.
Next, that bond allocation. It is true that rates could rise yet further, and it is possible that we could yet experience some price declines in bonds, particularly those with longer duration. On the other hand, if we head into a recession and the Fed is forced to cut rates, bonds will offer a nice offset as the returns from cash start to decline. If nothing else, bonds are cheap in relative terms compared to stocks.
Finally, we always want to have at least a modest allocation to stocks. These are the engine of growth after all and it is unwise, in my view, to attempt to time the market to the extent that you get out of them completely. As long as you have a healthy allocation to cash and bonds, you always have funds that you can reallocate to stocks should there be a significant decline.
I hope this perspective has been helpful. Let me know what you think in the comments below!