


A Peek Into ETF Monkey's Personal Portfolio - Q2 2021

ETF Monkey was introduced to the world on June 3, 2015, when I wrote my very first article using this pseudonym for Seeking Alpha. Covering the Vanguard Total Stock Market ETF (VTI), it ultimately led to my introduction of The ETF Monkey Vanguard Core Portfolio.
Over the next year plus, I wrote several articles for Seeking Alpha, reviewing multiple ETFs as well as offering advice on such topics as portfolio rebalancing and integrating individual stocks into an ETF-anchored portfolio.
In roughly September, 2016, however, I thought it would be a good idea to share my personal portfolio with readers. After all, when reading the work of any financial author or prognosticator, it seemed to me the reader had a right to ask: “Does the author practice what they preach?” And so, on October 14, 2016, I released the article Practicing What I Preach - A Peek Into ETF Monkey’s Personal Portfolio.
In the article, I first offered a high-level overview of the asset classes held in my portfolio along with their respective weightings, followed by a list of my actual holdings, again by weight, along with a little commentary.
As time went on, I moved these updates from Seeking Alpha to my personal website. The last update I provided before taking a hiatus from writing was for Q3 of 2019.
This, then, is my first such update in almost two years. As the saying goes, ‘Don’t bury the lede,’ so, with that in mind, without any further ado, here’s the YTD performance for my portfolio.
Through Q2, the Dow is up by 12.73%, the S&P 500 by 14.41% and the Nasdaq 12.54%. Through Q2, my portfolio is up by 5.37%. While, honestly, I am slightly disappointed with these results, it must be remembered that, as I write this, I am a pre-retiree and if one or two small details work out feel that I am very close to taking the leap into retirement. As a result, my portfolio is relatively conservative in nature, as will become apparent in the next section.
The Big Picture
With that said, here’s a look at the big picture, my overall asset allocation. In this graphic, I offer two levels of detail; a somewhat detailed breakdown by 8 asset classes, then summarized at a higher level into 4 asset classes. The leftmost column contains the actual weightings as of 6/30/21, the second column my target weightings, and the third column the difference in relative percentage. In other words, cash, at an actual weighting of 4.56%, is 8.85% under my target weighting of 5.00%.
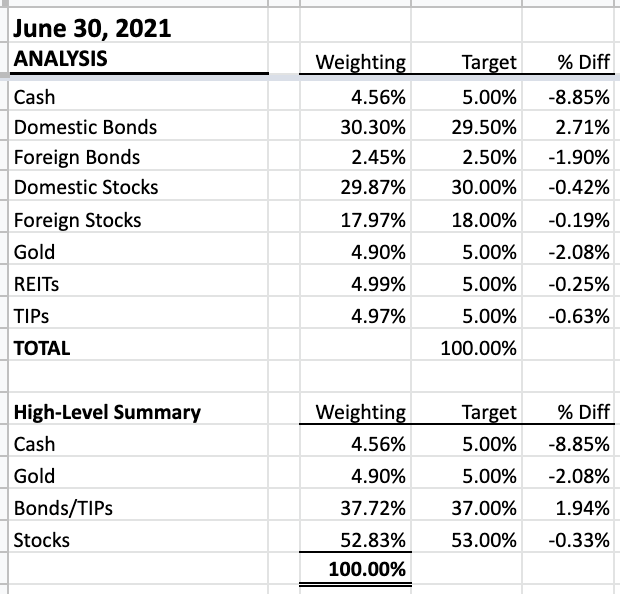
This high-level summary helps to explain my rather meager 5.37% YTD return. With interest rates as low as they are, the return on bonds has been modest, to say the least. And my other safe-haven asset, gold, has actually declined roughly 9% during 2021.
The Details
Here are my detailed holdings as of 6/30/21. Have a look and then I will offer just a few comments.

With respect to bonds, you will notice that the bulk of my allocation is almost evenly split between BSV and AGG. Overall, that gives me a duration of roughly 5 years, keeping my interest-rate risk at a moderate level. (NOTE: For more on duration, see this article.) Looking a little further down the chart, you will see a small allocation to TLT, which features 20-year U.S. Treasury bonds. Also mixed in is an allocation of roughly 5% to TIPS, for a little inflation protection.
In terms of stocks, you will quickly be able to see which ETFs I have selected for both my domestic and international holdings. In terms of gold, this article offers more detail about the 3 ETFs I selected, and why. Finally, in terms of real estate, this article explains HOMZ, my latest addition, and how I integrated it into the portfolio.
Well, that’s all for now. Feel free to leave any comments, or ask any questions you wish, in the comments section below. I hope you have enjoyed reading.