Readers are familiar with my recent coverage and outlook with respect to the Fed, culminating in my most recent post featuring Jerome Powell staying on message reiterating the Fed’s determination to bring inflation under control.
With respect to that, here’s one quick hit from this morning.

In the article linked above, I concluded with these observations.
. . . in recent days I have been nibbling at both AGG and TLT. As can be seen in the above graphic, over the past week TLT in particular has traded at its lowest price since 2013. The current yield is sitting at a little over 2.6%.
In the case of both AGG & TLT, it may be that we are in for at least a measure of additional price declines as the Fed continues with its interest rates increases. At the same time, as we get into the first part of 2023, we might be sitting at a point where these vehicles are generating a solid level of current income, as well as opportunities for capital gains if interest rates go the other way.
In line with that, as part of my work for Seeking Alpha, I decided to review Vanguard Long-Term Bond ETF (BLV) for the first time. Here’s a handy link for any who may be interested in taking a peek. I suggested to readers that this ETF might be a good one to bookmark as we approach the end of 2022, in line with the timing of fed funds increases as forecast by Goldman Sachs above.
Venturing Further Afield: BLV, VCLT, and TLT
I ended my Seeking Alpha article with a very brief comparison between BLV and iShares 20+ Year Treasury Bond ETF (TLT). In turn, this generated some interesting discussion from readers in the comments section as to which ETF might be the best to focus on in 2023.
This back and forth with readers caused me to take a closer look at the performance of 3 highly-rated long-term bond ETFs. While I will not perform an in-depth review of the ETFs in this article, I will very quickly touch on fundamental differences between them, as well as give you a historical look at their respective risk/reward profiles.
First of all, for TLT.
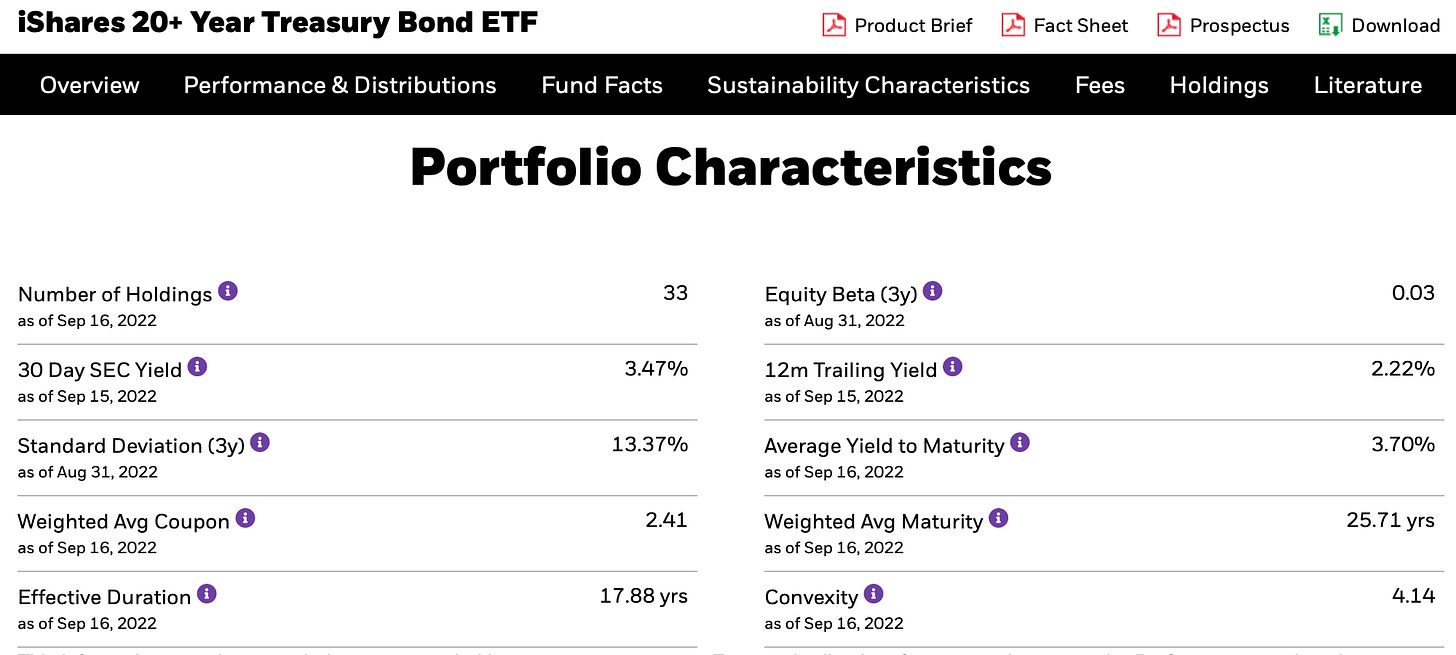
In the case of TLT, I didn’t bother with any graphics as to credit quality. These are U.S. treasuries, as safe an investment as there is. For purposes of our comparison, however, please take note of the maturity and duration values; 25.71 years and 17.88 years, respectively.
With that, two graphics for BLV. First the portfolio composition.
Next, credit quality.
Summarized quickly, the maturity and duration values are a little shorter than TLT, at 23.1 years and 14.8 years, respectively. However, since BLV includes corporate bonds, credit risk is higher. As can be seen, some 27% of the bonds in the fund carry a BBB credit rating, the lowest investment-grade rating.
Finally, the same two graphics for VCLT. First the portfolio composition.
Next, credit quality.
In terms of maturity VCLT is virtually identical to BLV. Its duration, however, is approximately a year shorter. At the same time, you are now up to a full 49% in BBB-rated bonds. Since, in general, the lower the rating of the bond, the higher coupon the issuer must pay. As a result, more of the total return comes from higher coupon payments and less from maturity of the bonds.
Taking A Look At Performance
But how have these 3 ETFs performed, comparatively, over time? I took the time to research this, using the helpful tools on PortfolioVisualizer.com.
This backtest covers the period from January 2010 to the present, or approximately 12-1/2 years. One little detail. Please note that I substituted VBLLX, the mutual fund equivalent for BLV for purposes of the comparison. This allowed for taking the comparison back a little further in time.
First of all, here is a link to the backtest, for any interested in taking a look for themselves.
Without further ado, here are the results.
As can be seen, VCLT is the winner in terms of absolute performance. BLV comes in a very close second. Over this period, TLT returned the least in terms of total return.
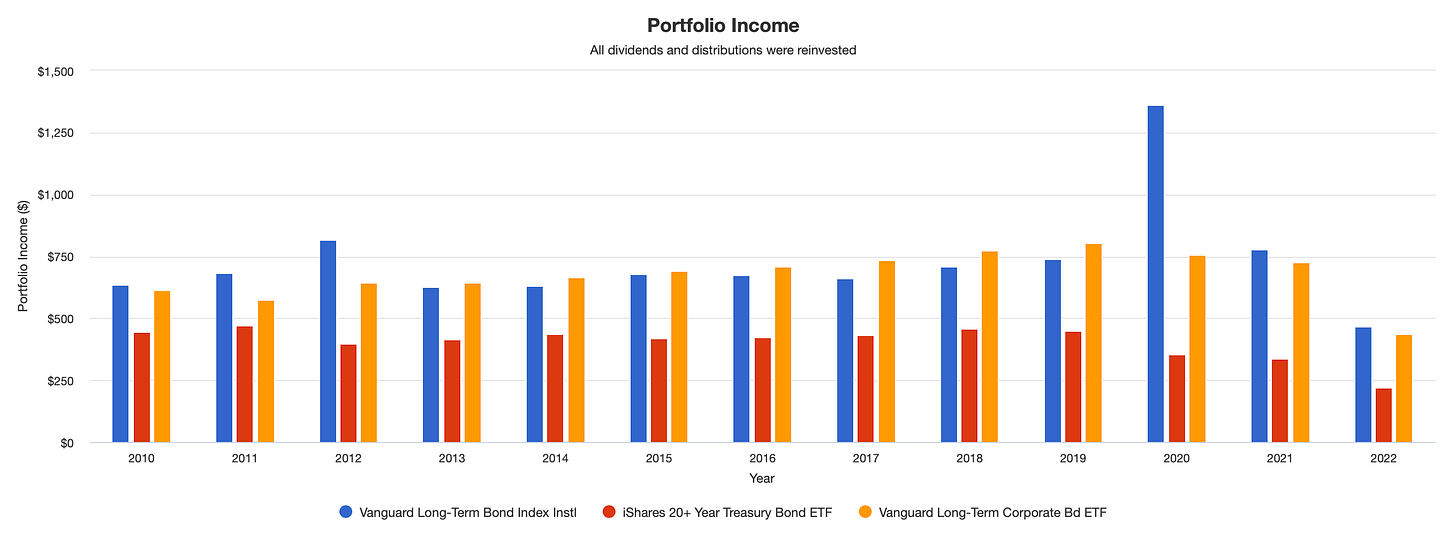
Next, here is the income generated by each option.
Are you perhaps noticing the same thing that I am? In short, BLV appears to be a very strong candidate for consideration in your portfolio. It beats out TLT on both the Sharpe and Sortino ratios, measures of risk-adjusted return. In contrast, VCLT edges it out very slightly in terms of the Sharpe ratio, but BLV reclaims the crown, so to speak, on the Sortino ratio, a variant of the Sharpe ratio that focuses on downside protection.
What Might This All Mean In 2023?
Here’s the bottom line. It appears to me that, barring any huge unforeseen surprises—such as a sudden end to the war in Ukraine—all 3 ETFs bear watching as we near the end of 2022.
As featured above, I find myself more and more enamored with BLV as a result of my recent research. It appears to offer a nice “middle of the road” option between TLT and its riskier cousin, VCLT.
Ironically, however, it could well be the case that TLT will be the winner out of the 3 in 2023! Due to its slightly longer maturity and duration profile, TLT has experienced an even greater downturn of late than either BLV or VCLT. However, at whatever juncture we reach a point where long-term rates begin to fall, that downturn could well reverse even more powerfully than BLV and VCLT.
What do you think? I’d love to hear from you in the comments section below.
Please Consider Following Me On Twitter
Last thing before I leave you. I would like to extend the sincerest of thanks to those of you who have been following me for some time now, and a warm welcome to a fairly significant group of you who have joined within the last month! I appreciate that you honor me with your time by reading my work.
For those of you who use Twitter, might I suggest that you follow me there as well? Here’s a handy link for any who are interested. I don’t tweet excessively, so I promise you won’t be overwhelmed, but it is the platform I use from time to time to share “quick hits” of little things that catch my eye and might be of interest to you as well.
With that, I will bid you well until we see each other again.


